


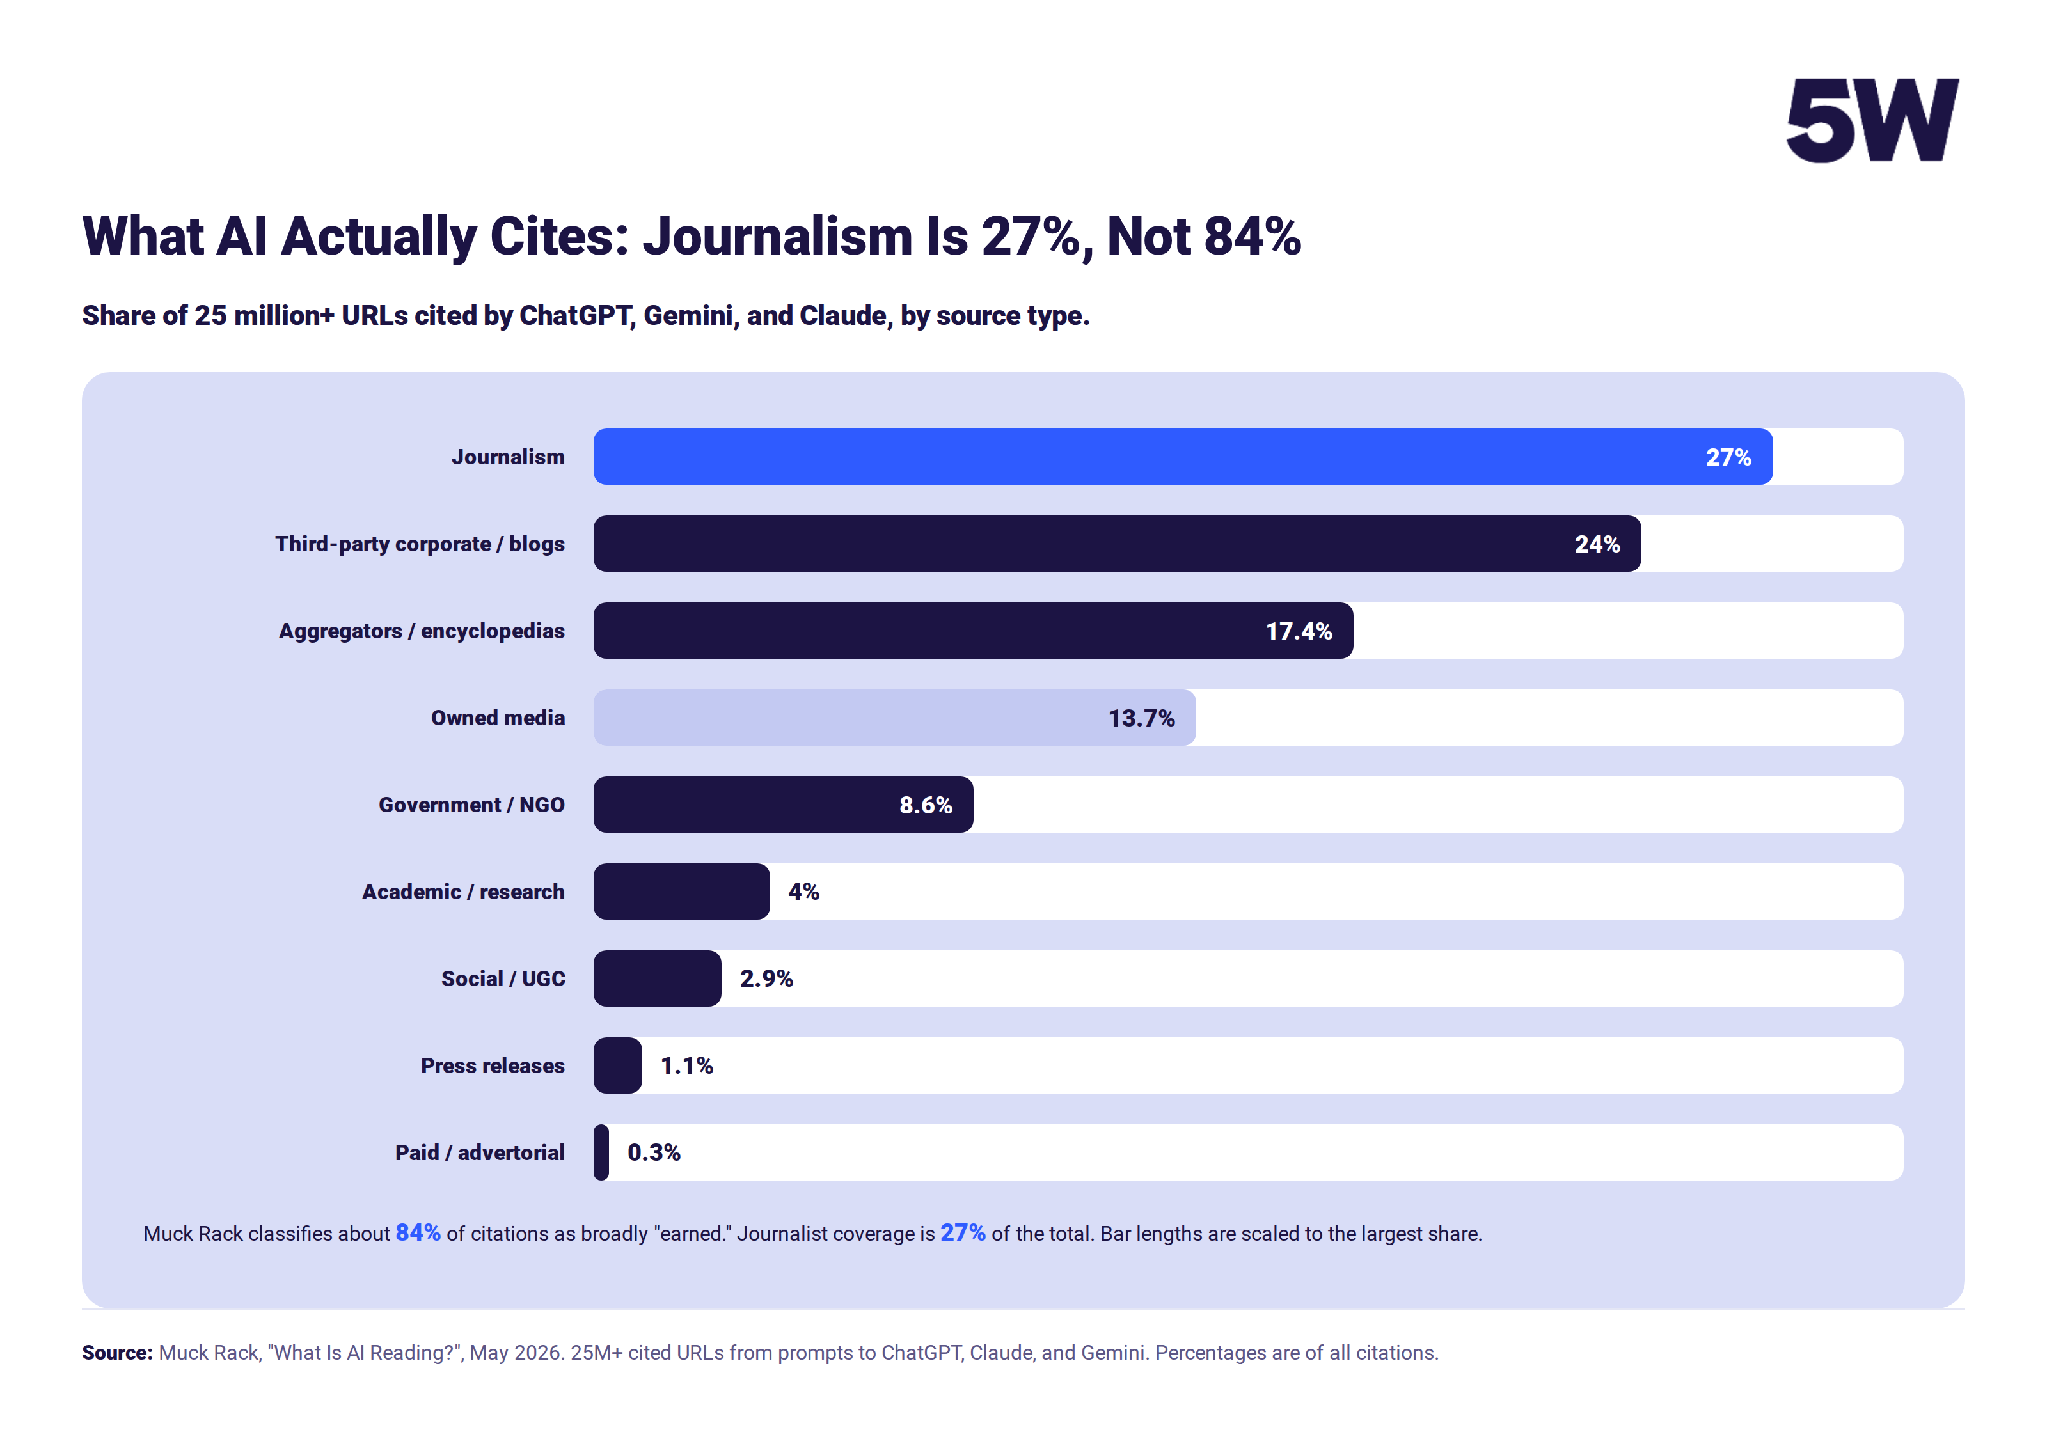
Despite lots of chatter, earned media doesn't automatically equal AI visibility, but research supports that it's one of the largest inputs. Muck Rack's May 2026 study tagged 84% of 25 million AI citations as earned. Journalism accounted for 27% of those sources, so if a dashboard treats coverage counts as AI visibility, it may misreport the numbers.
This review offers guidance toward developing measures of credibility and providing evidence to justify budget allocations for 2027.
There's nothing particularly difficult about this model: earned media provides third-party evidence, and AI models recommend or ignore it. AI visibility is an outcome, but no empirical work has assigned causal weight to any of these steps.
That gap should guide measurement and support integrating earned media and GEO strategies.
What counts as earned media, and what is AI visibility?
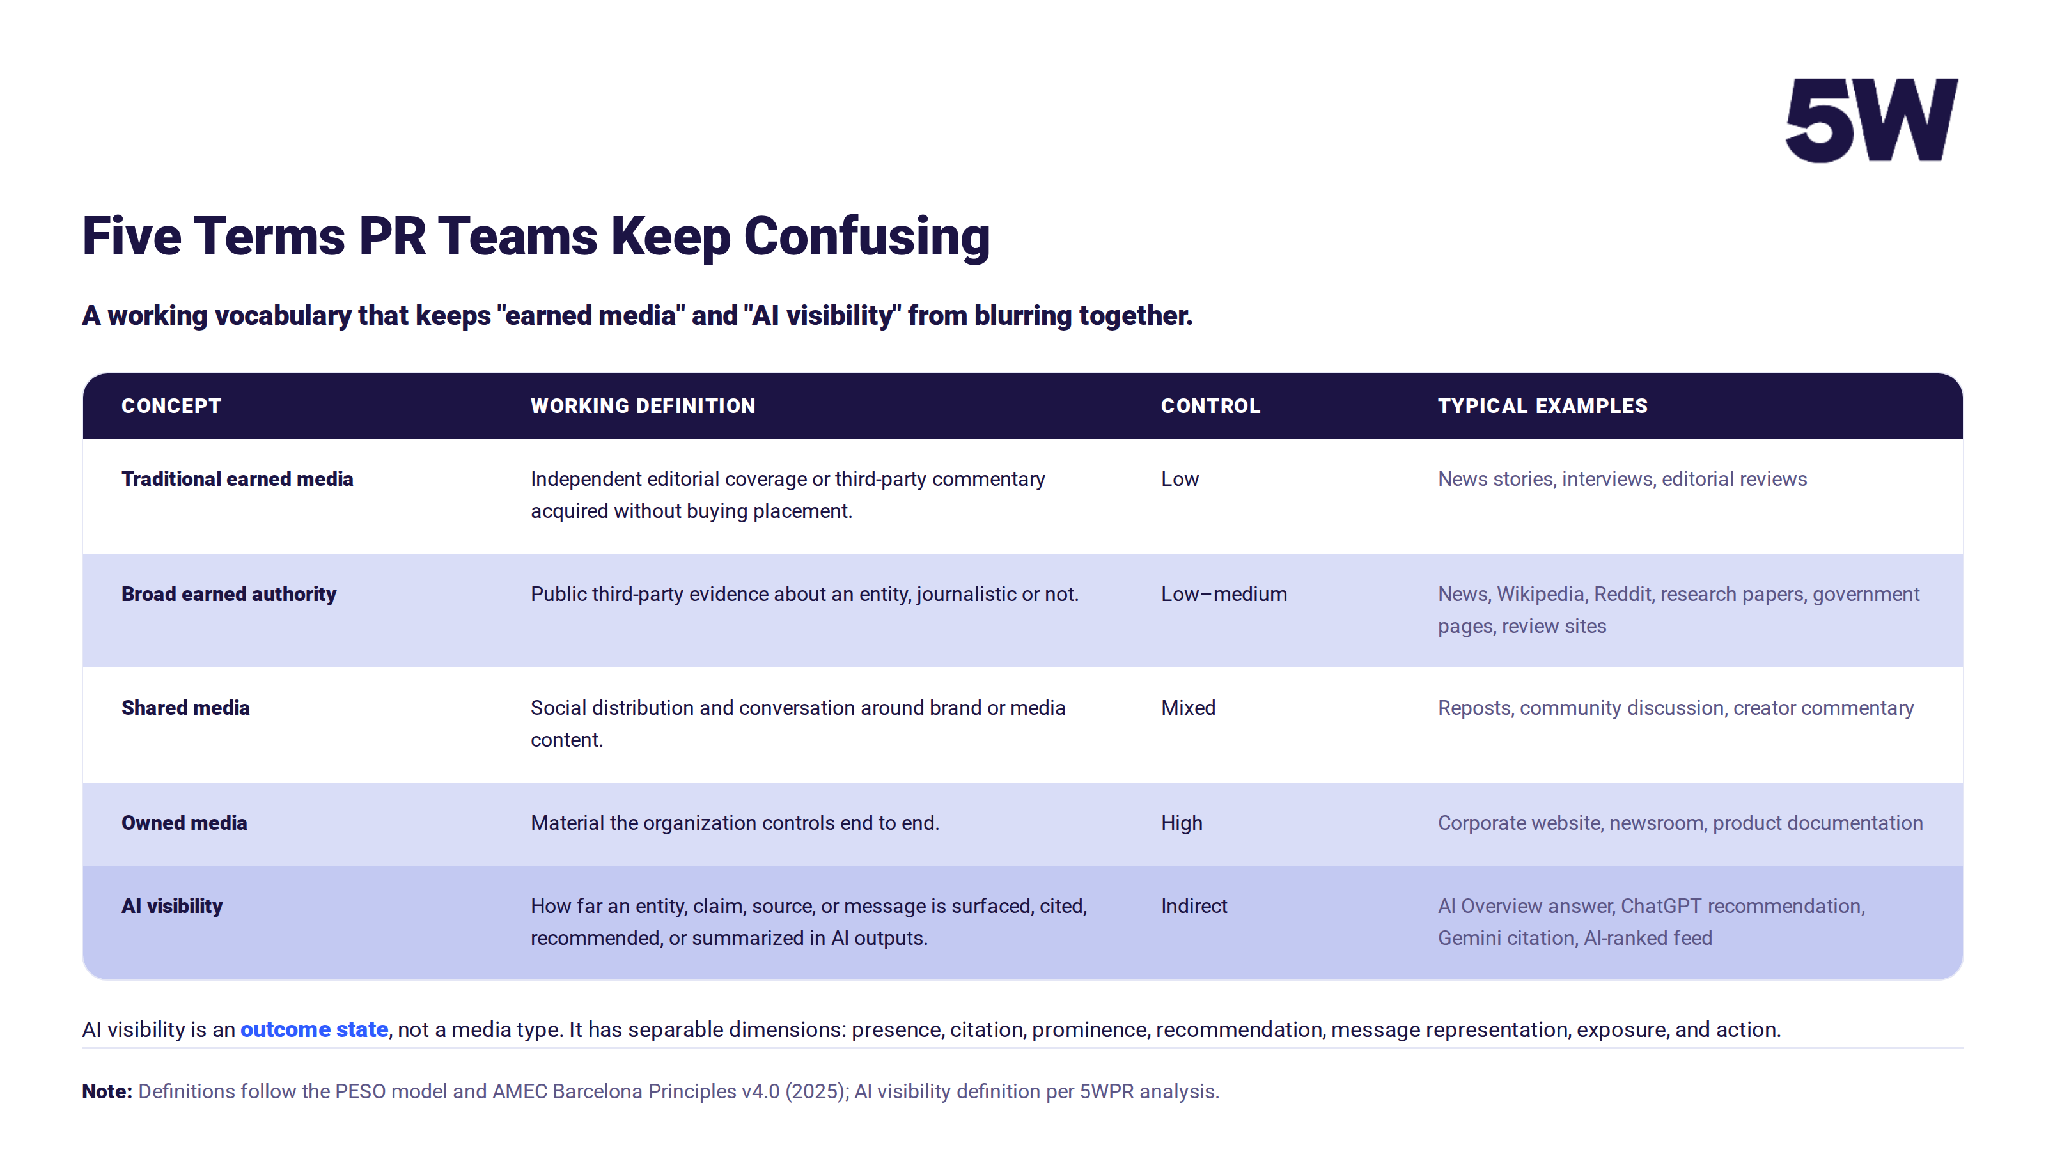
How do we define earned media, and how do we define AI visibility? Earned media is third-party coverage (i.e. "Best of") that comes from outside an owned channel (a company's own website). The PESO model defines media types as paid, earned, shared, and owned. The Barcelona Principles V. 4.0 (2025), developed by AMEC, advises organizations to measure against all four.
Muck Rack's earned media bucket incorporates journalism, third-party blogs, encyclopedias, government pages, research, and social posts. The reported splits are journalism 27%, third-party corporate and blogs 24%, and aggregators and encyclopedias 17.4%. Government and NGO pages take 8.6%, research 4%, and social content 2.9%.
Owned media takes 13.7%, and press releases 1.1%. So "84% of AI citations are earned" holds only under the broad definition.
AI visibility is an outcome that helps show how often a brand, claim, or source appears in AI answers and feeds. It has seven measurable parts: presence, citation, prominence, recommendation, message accuracy, exposure, and action, but blended visibility scores can skew metrics and recreate past impression challenges.
Some third-party vendors track certain parts of AI visibility. Ahrefs defines mentions, citations, and AI impressions and seeds impressions based on search demand, but its impressions are a model, not observed exposure. This foundational GEO paper increased measured answer visibility by up to 40% by changing source content.
How does AI decide which earned media becomes visible?
AI impacts earned-media exposure through multiple mechanisms, including but not limited to, creation and feed recommendation, automated amplification, answer retrieval, and moderation. Data supports the first, while the remaining four determine what content gets visibility. Together they form an AI selection funnel that often eliminates brands before buyers can comparison shop.
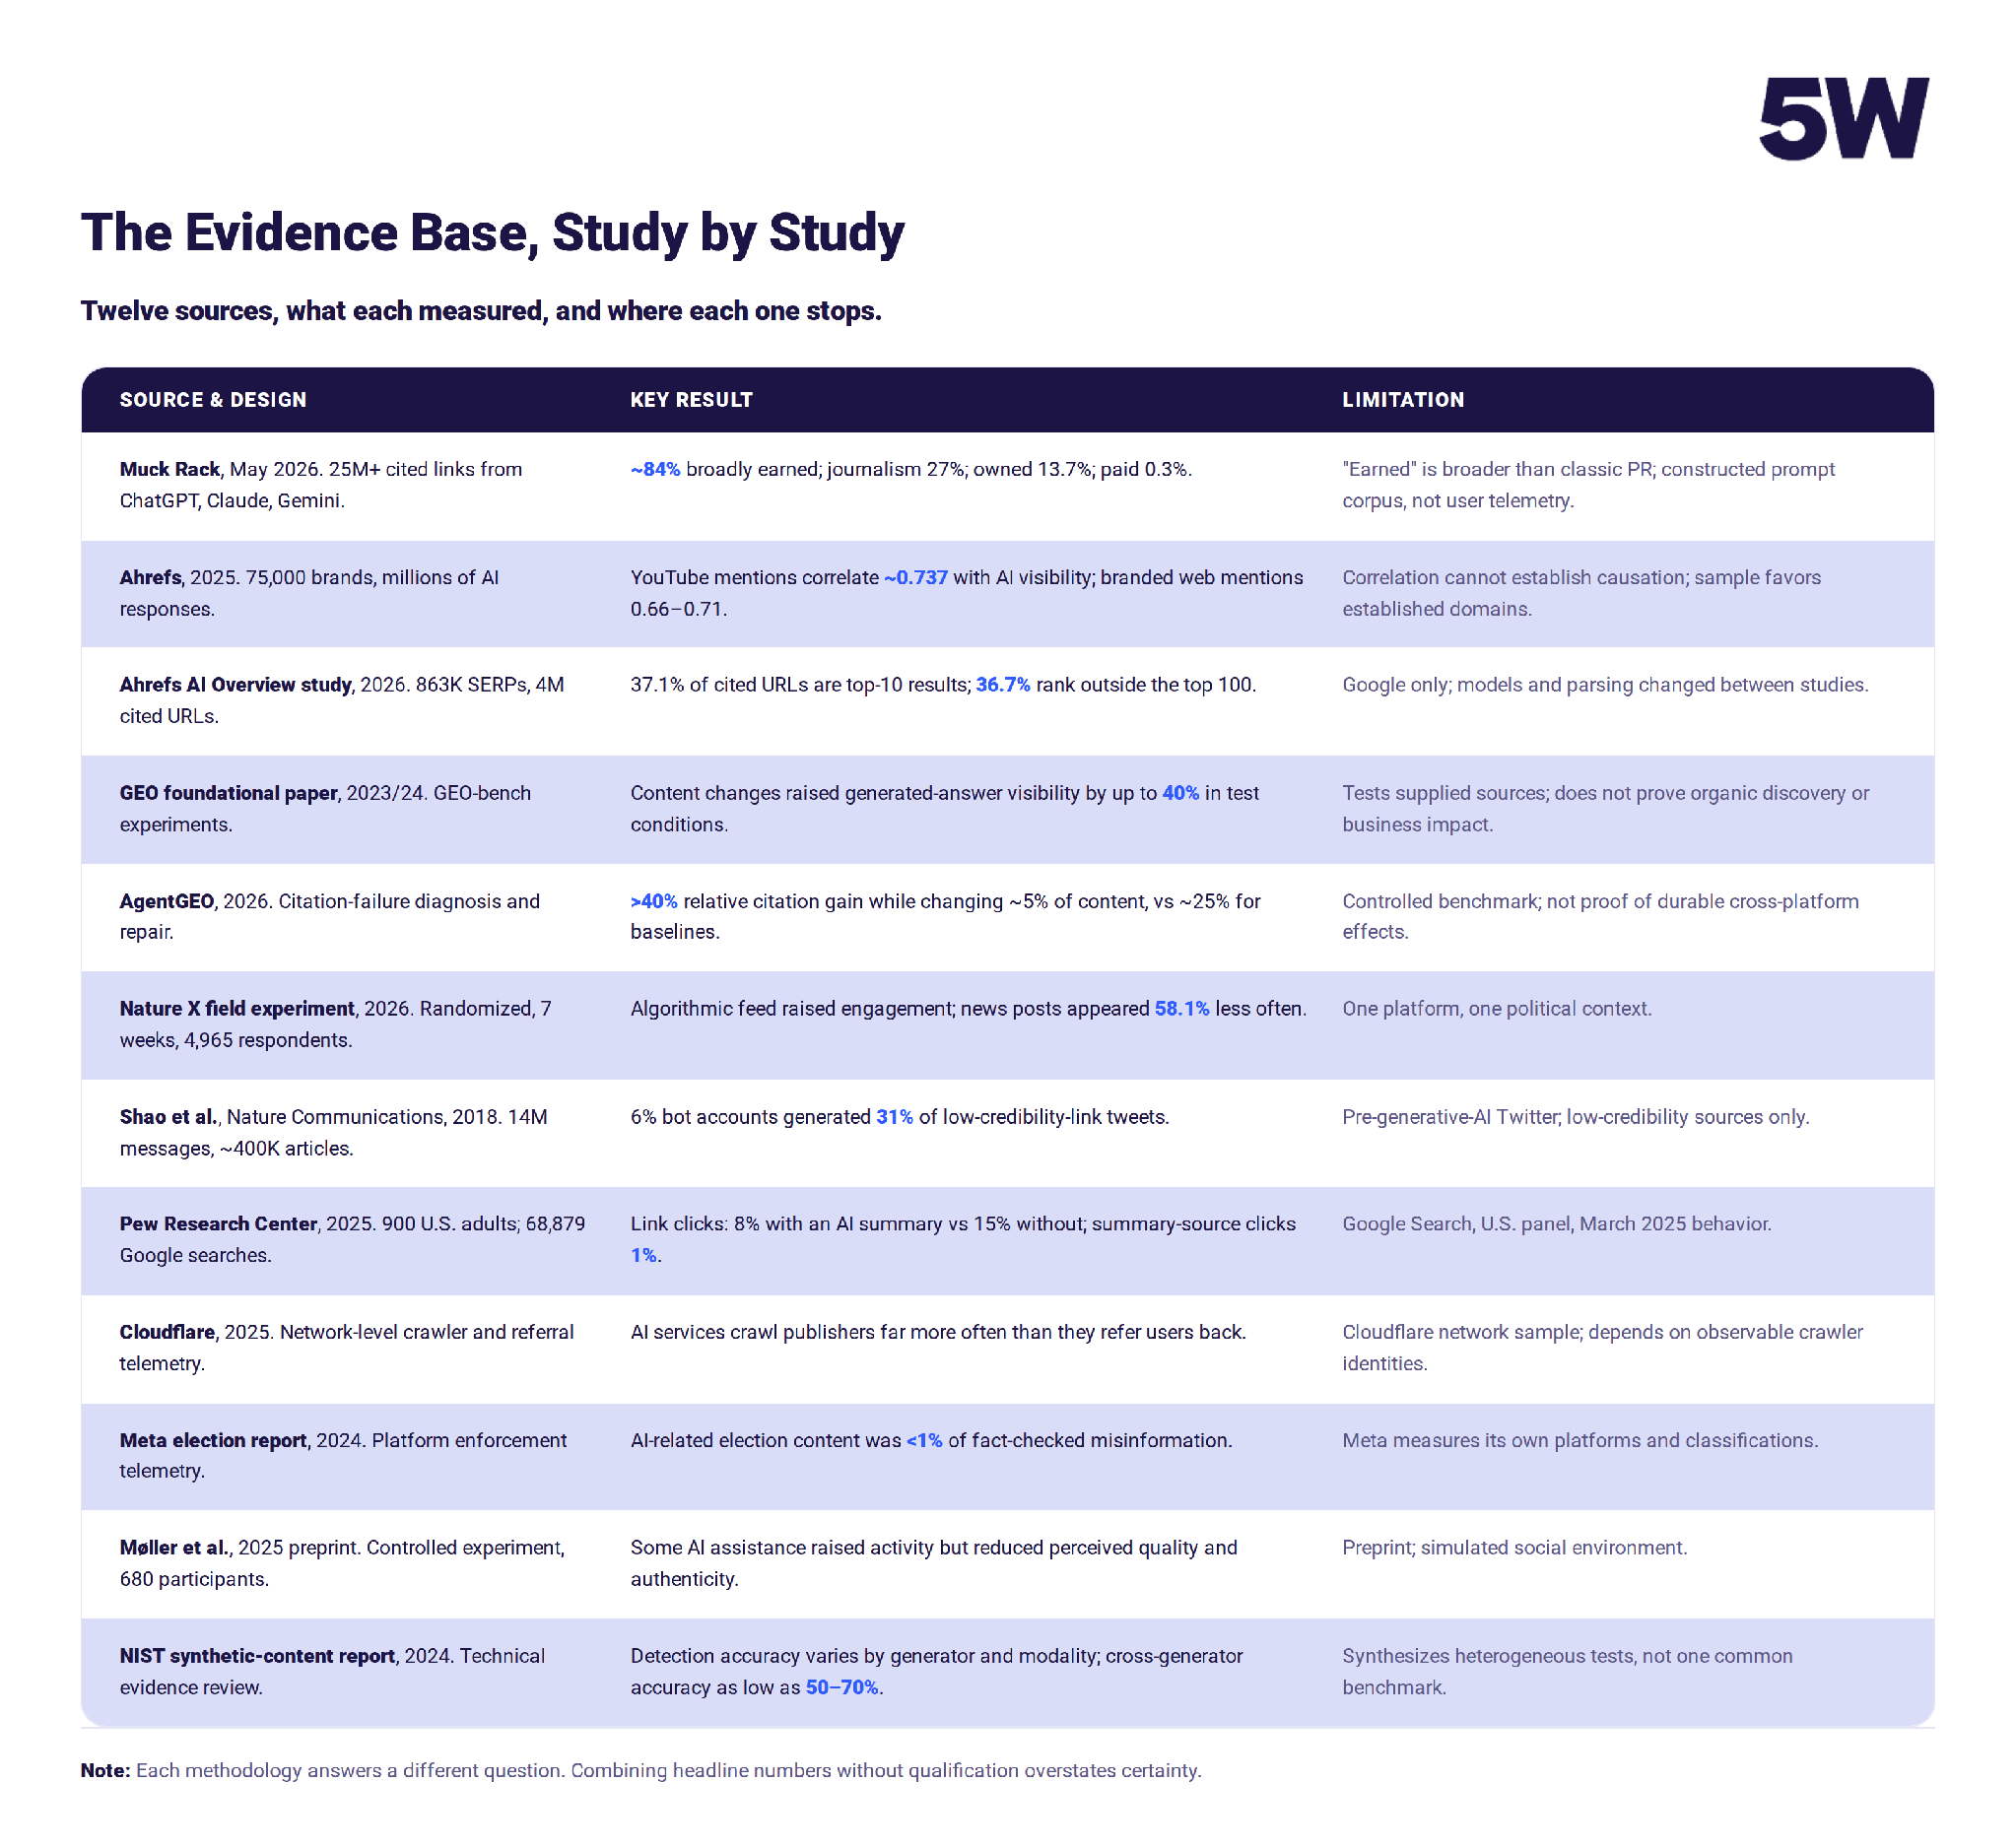
Creation lowers cost, not distrust. A 2025 experiment with 680 U.S. participants found AI models increased posting volume and some engagement while cutting perceived quality and authenticity. Because the study is a preprint in a simulated feed, it may be less reliable than field evidence, but the pattern holds up: cheap production doesn't buy exposure.
Feeds change reach causally. A 2026 randomized Nature experiment on X assigned users to algorithmic or chronological feeds for seven weeks. In total, 4,965 people finished the final survey. The algorithm raised engagement. News posts appeared 58.1% less often. Activist posts appeared 27.4% more often, and entertainment posts 21.5% more. Placement and exposure are separate events. The authors caution that this study covers one platform in 2023 and note that earlier Meta experiments changed feeds without moving political attitudes.
Bots fake momentum. Shao and colleagues analyzed 14 million Twitter messages carrying 400,000 articles. Bots were 6% of accounts yet produced 31% of tweets linking low-credibility material. Bots hit early and targeted influential users. The study predates modern generative AI. And the 2018 Science study by Vosoughi, Roy, and Aral found humans, not bots, drove false-news spread. Automation is one factor, not the only one.
Retrieval varies by model and query. In Muck Rack's sample, ChatGPT cited sources in 96% of responses, Gemini in 82%, Claude in 55%. Journalism appeared in about 46% of industry-trend answers, twice its rate for some how-to queries. Over half of journalism citations were under a year old. Automotive AI search citations pull from KBB, Edmunds, and NHTSA, not press.
NIST splits the field into provenance tracking and detection. C2PA credentials bind an asset's origin and edit history, but they don't certify its claims. Detection remains weak. NIST cites cross-generator image accuracy of 61% to 70% in one test and 50% to 62% in another. Short-text detection can run near chance, with higher false positives for non-native English writers.
What does the evidence prove, and what does it suggest?
The evidence proves one pattern from two independent methods: AI answers favor third-party sources over brand claims. Muck Rack's research continues to support that claim. Ahrefs' 75,000-brand analysis finds branded web mentions correlate 0.66 to 0.71 with AI visibility. YouTube mentions correlate at 0.737, making them the strongest factor in the analysis.
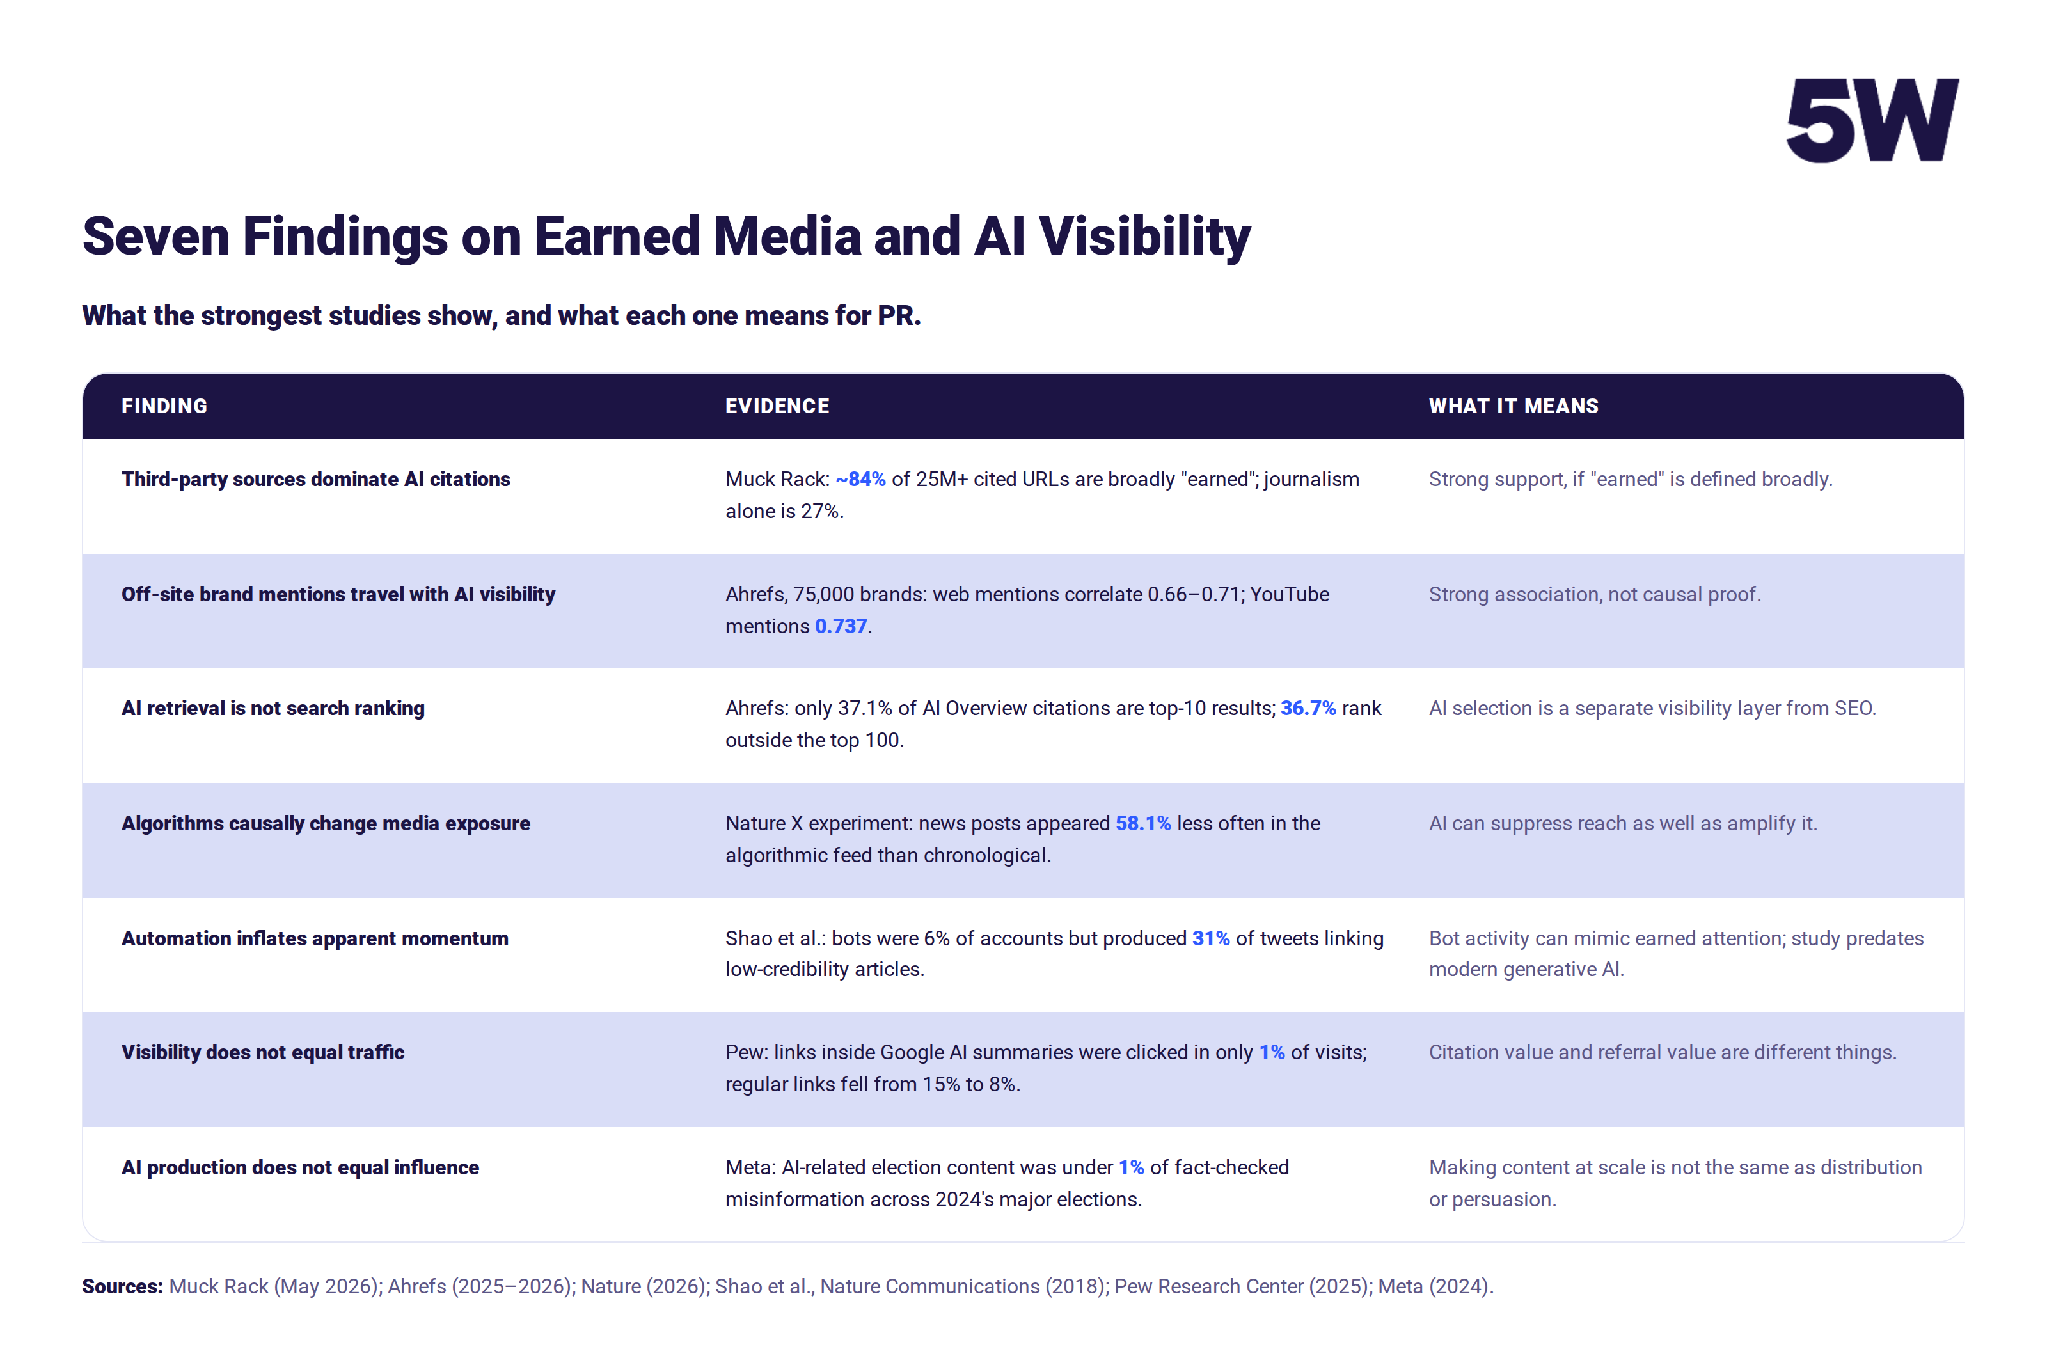
Remember that convergence isn't causation. Brand size, demand, and ad spend help produce coverage and AI mentions. Ahrefs found the same big brands across assistants, with a cross-platform output overlap correlation near 0.78.
A separate Ahrefs study of 4 million AI Overview citations found YouTube supplied 5.6% of all cited URLs. It supplied 18.2% of cited URLs ranking outside Google's top 100. Transcripts, creator interviews, podcasts, and reviews all widen a machine-readable record.
Selection is probabilistic. A 2026 survey of 45 GEO studies maps the stages: crawling, retrieval, reranking, citation, prominence, and user behavior. It finds strong evidence that search shapes what information gets retrieved. It finds weak evidence for durable, cross-platform gains.
Publications aren't a fixed value anymore. An AI model can summarize and share a story without a citation. Pew tracked 68,879 Google searches and found that users clicked a result on 8% of visits with an AI summary, versus 15% without it. Links inside summaries drew clicks on just 1% of visits. Sessions ended after 26% of AI-summary pages versus 16% otherwise. Cloudflare's crawl data shows that AI models read publishers far more than they refer visitors.
In a zero-click environment, a media placement's value shifts from traffic to retrieval evidence, citation authority, and reputation signals.
How can teams measure AI visibility?
Measure AI visibility in separate layers: media output, AI recommendations, overall exposure, and outcomes.
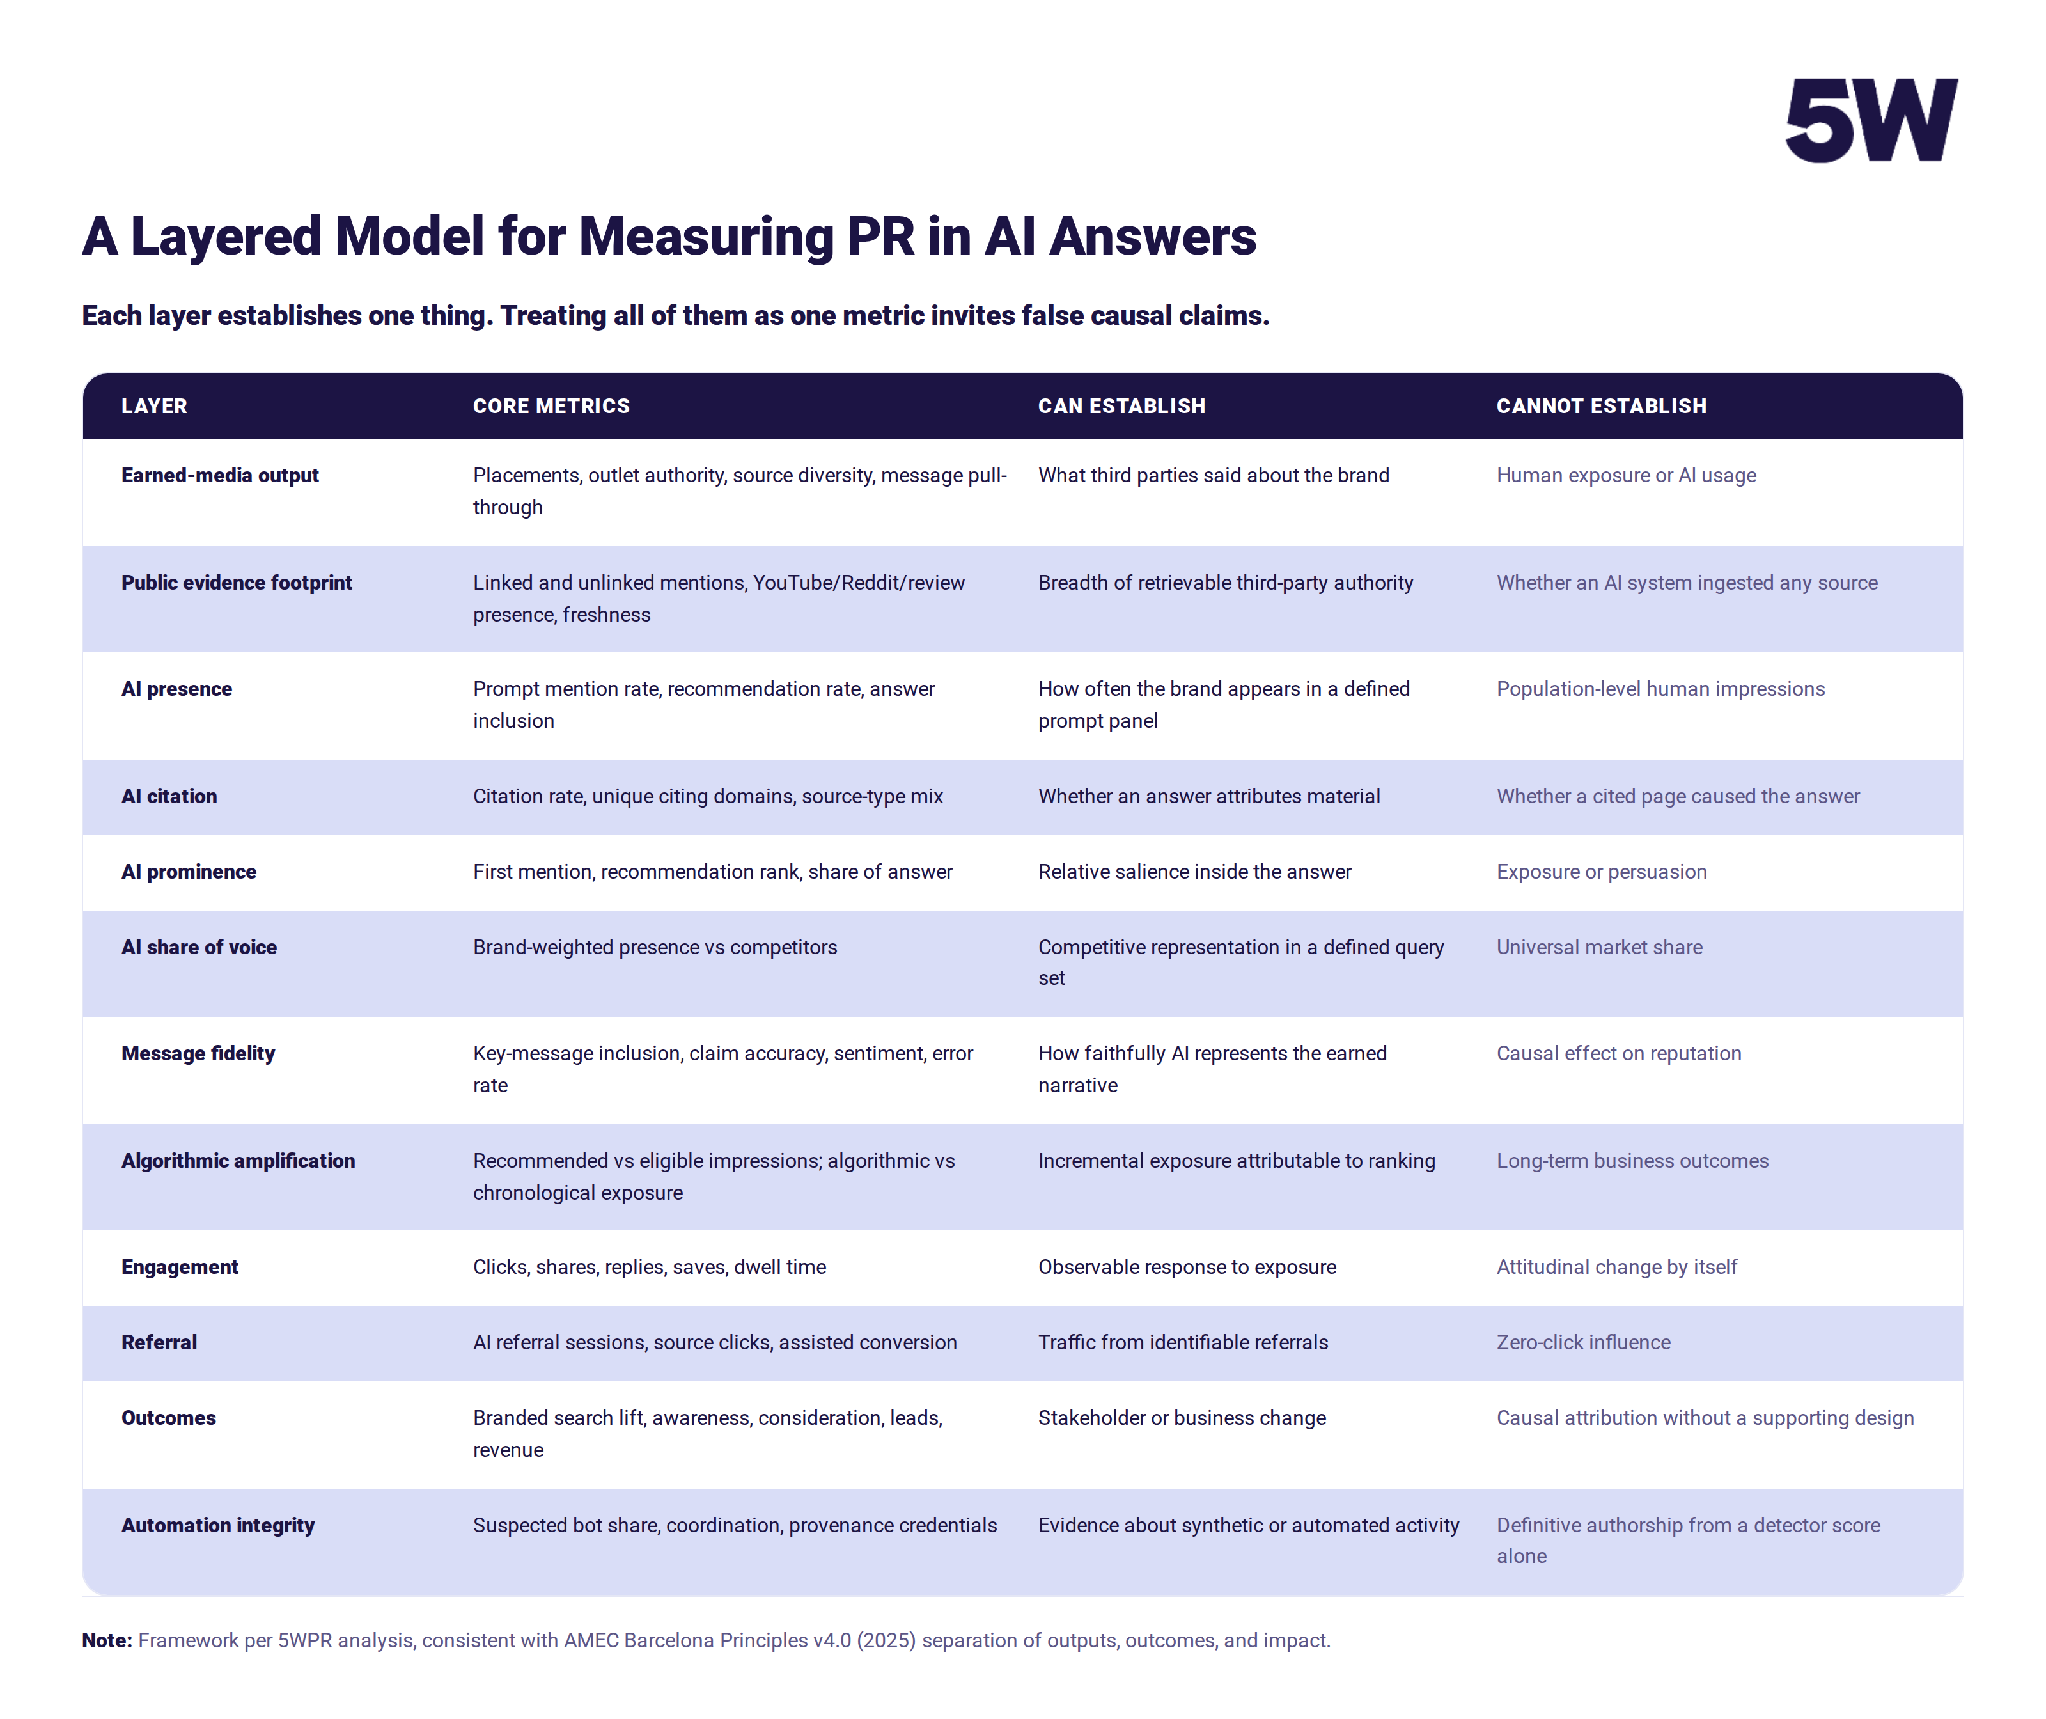
Build and monitor a prompt panel: AI Answers change with wording, model version, time, user personalization, and location. Creating multiple, relevant prompt families provides a broad view of AI visibility. These prompts should include branded questions. Include category questions like "Which companies lead in X, " high-intent evaluation questions, reputation/sentiment questions, and some journalist and stakeholder research questions. Repeat each prompt across models and report the sample size, dates, models, repetitions, and web access. Anchor the panel with first-party data such as Google's AI Performance data.
Use explicit denominators. "AI mentions rose 40%" can mean several incompatible events. Write: the brand appeared in 28% of 2,000 tracked responses in Q3, up from 20% in Q2. That's an 8-point increase, or 40% relative to the previous quarter. The method helps ensure modeled vendor impressions aren't mistaken for observed ones.
Track a source-claim-answer chain. Log the outlet, URL, date, and claims from media campaigns. Add citation status by model, note the first citation, and trigger prompts and referrals. That dataset tests if research-led stories convert to citations more often. It shows which outlets persist and if gains follow campaigns.
Separate correlation from lift. A 0.737 correlation doesn't mean one more video will amount to 0.737 units of visibility. Match competitors, control topics, time-series breaks, or staggered launches. Here's an example of what not to measure: "120 stories increased share of voice by 8 points as a result of a PR campaign". Here's a better example: "Our share of voice rose 8 points against a 1- to 2-point competitor move, and 37% of new citations were traced to campaign coverage. The second is an attribution chain; the first could be a coincidence."
Where does the claim break down?
Claims can break down at multiple points, and definitions change across studies. Brand size can distort the overall picture. Large brands often stack articles, links, videos, and Wikipedia pages together. Control for size, demand, and content volume before claiming credit. A good reference is how Brooks outran Nike in AI search with consistent, machine-readable claims that speak to their users' needs over robust marketing copy.
Remember that citation isn't influence. A cited page can appear below the fold or support an unrelated fact. AgentGEO's 2026 work shows content can shape answers without earning the citation. Its targeted fixes lifted citations over 40% while changing 5% of content. Visibility is often zero-click, per the Pew and Cloudflare numbers above.
High AI visibility can coexist with flat referral traffic. Cheap production fails in a different direction. Meta's 2024 election report found AI content under 1% of fact-checked misinformation. Finally, detection estimates are often misleading. Any "X% of coverage was AI-written" claim rests on the NIST accuracy limits above.
Vendor data often add a caveat. Muck Rack builds consumer-style prompts while Ahrefs seeds prompts based on search demand. Neither is a census of real AI conversations. Ahrefs found 38% overlap between AI Overview citations and top-ten results in March 2026, down from 76%. This information supports maintaining a fixed prompt panel and labeling model changes.
What should you change in the PR budget and dashboard?
Three considerations: strategy, assets, and scoring.
Strategy: fund corroboration, not volume. Treat each placement as the start of an authority supply chain with four roles. First, human exposure. Second, social distribution. Third, machine-readable authority. Fourth, generative representation. Ahrefs found almost no link between site page count and AI visibility.
Assets: provide concise information the model can extract and share. Here's a weak example: Our breakthrough platform transforms customer experience. And here's a strong example: In a 2,400-customer study, January through March 2026, median resolution time fell from 11.2 to 7.6 hours. The latter provides journalists and models with an entity, a metric, a denominator, and a timeframe, while original research builds on those findings. The citation mix includes research and government sources, while trend prompts most frequently cite journalism.
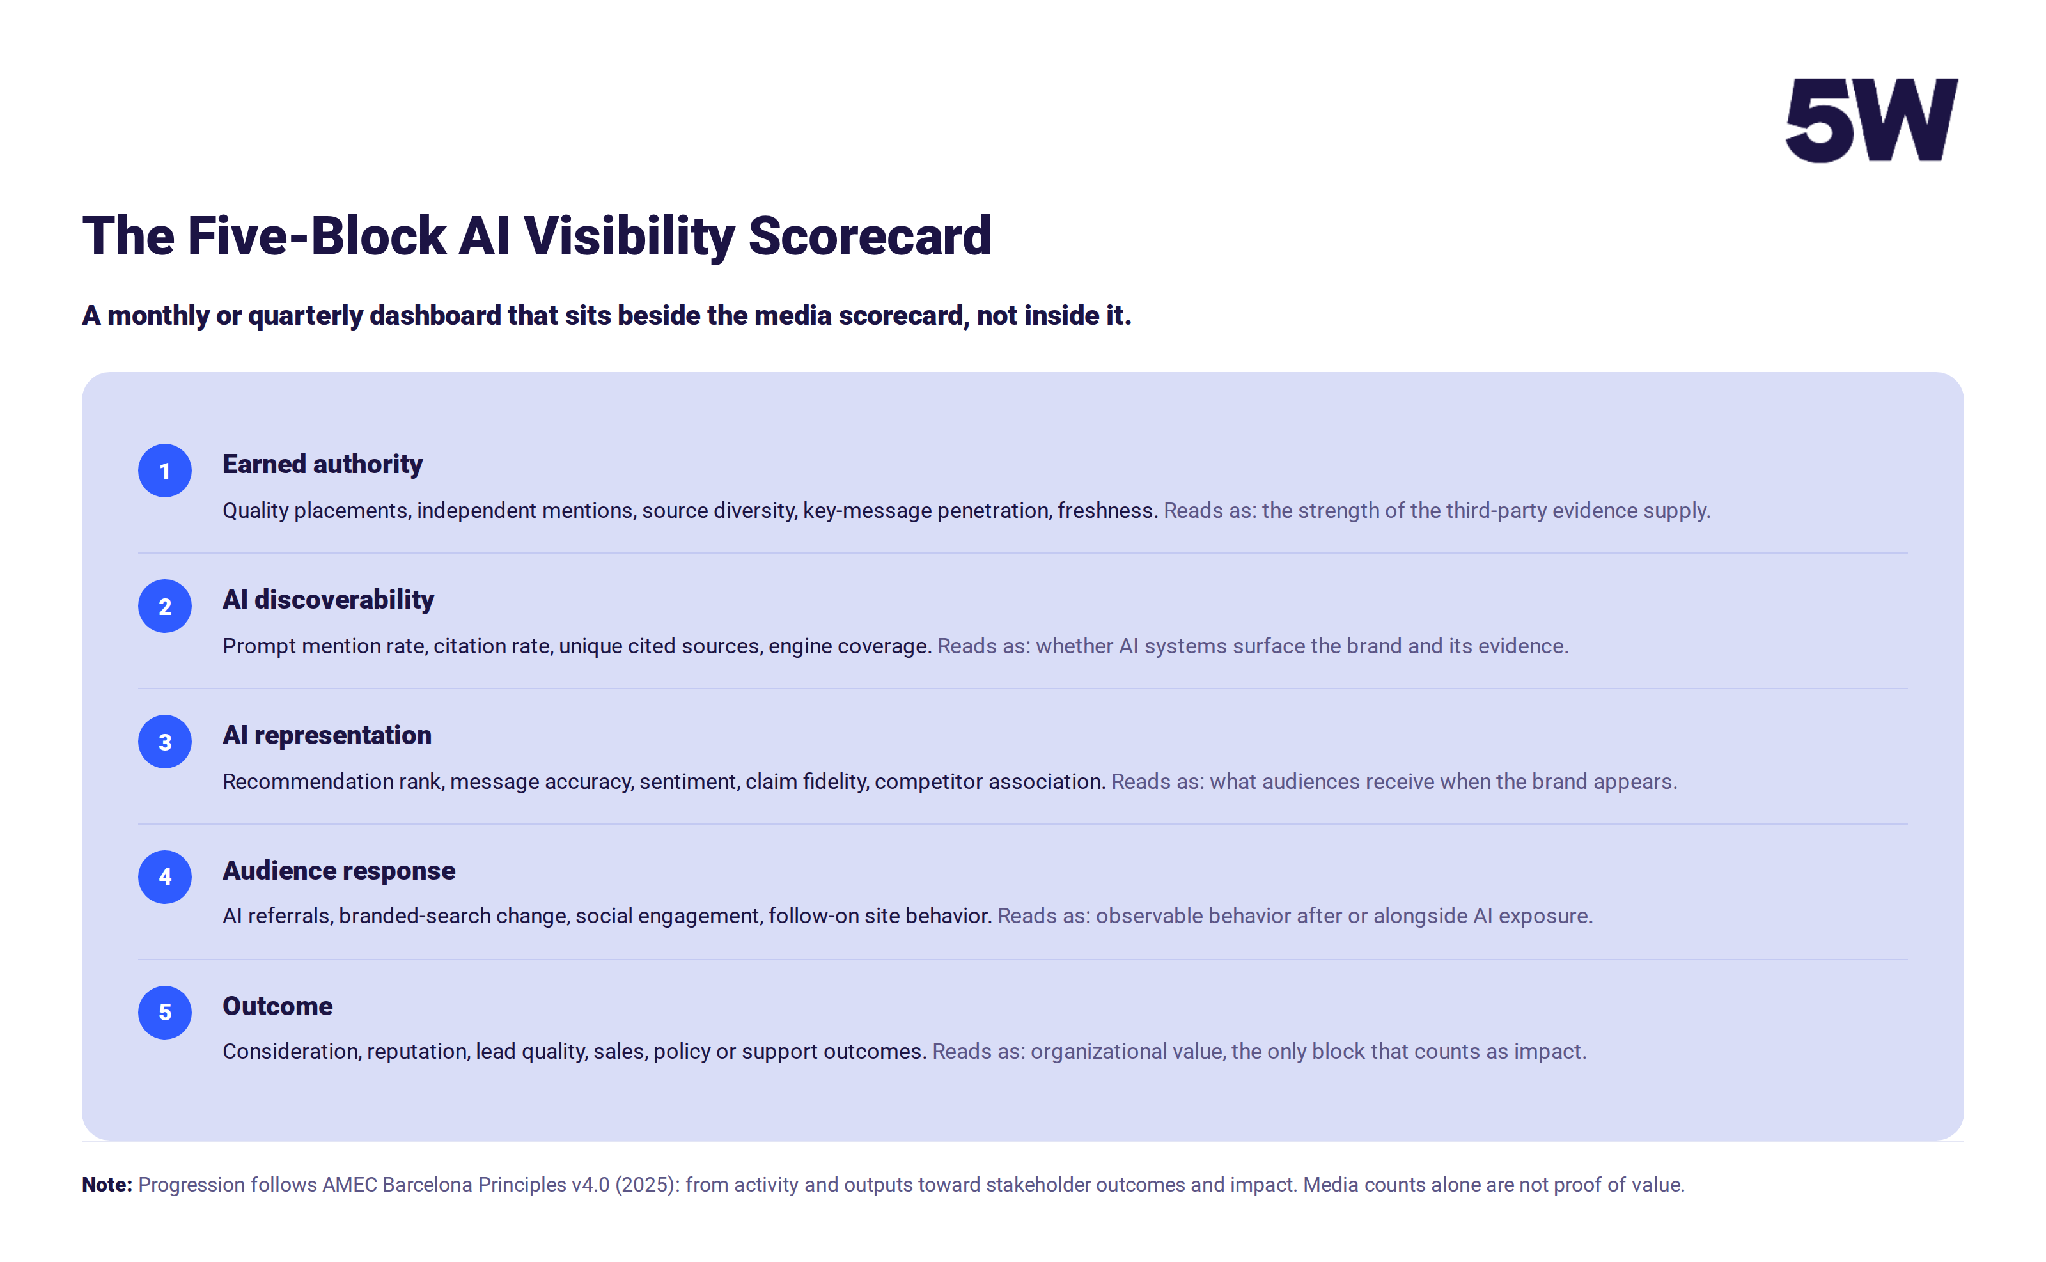
Scoring: five potential blocks, plus two new KPIs. The blocks: earned authority, AI discoverability, AI representation, audience response, and outcome.
KPI one: earned-to-AI conversion rate, the share of major placements later cited by AI.
KPI two: cited-source diversity, the count of unique third-party domains AI cites for you. Lower diversity in higher conversions can reduce dependence on publishers. Use this number as an anchor point for tracking the four components of the "freshness" of academic citations: (1) time elapsed since initial publication ("citation lag"), (2) likelihood that source will persist over time ("persistence"), (3) rate at which references cease to be valid ("half-life"), and (4) rate at which other sources replace them.
Tracking these is crucial because most journal articles referenced in AI models were published within the past year; however, their value can extend beyond the news article's life cycle.
Additionally, consider separating these four areas into individual AI metrics: (1) whether or not the answers generated by an AI model were visible, (2) how many feeds an AI model's results were exposed to, (3) if an AI model assisted with producing content, and (4) if an AI model was able to provide credible information about where it found its original material ("provenance integrity").
Before you launch a larger campaign, use the above method to establish a baseline for your test group (panel) and hold a control group with similar characteristics (matched controls). Track each new reference source added during the campaign. Once complete, check if the new references are cited as a result of the campaign coverage.
Report AI visibility as an exposure opportunity, but not a business impact. Mentions are outputs, citations are attribution signals, and modeled impressions are estimates. Clicks show behavior, consideration shows an outcome, and revenue shows impact. Pew's 1% summary-click rate is the standing reason not to skip steps.
So is earned media the same as AI visibility?
The evidence rejects a literal equivalence and supports a strong contribution. It partially supports causation, but that contribution is only proven under bounded test conditions.
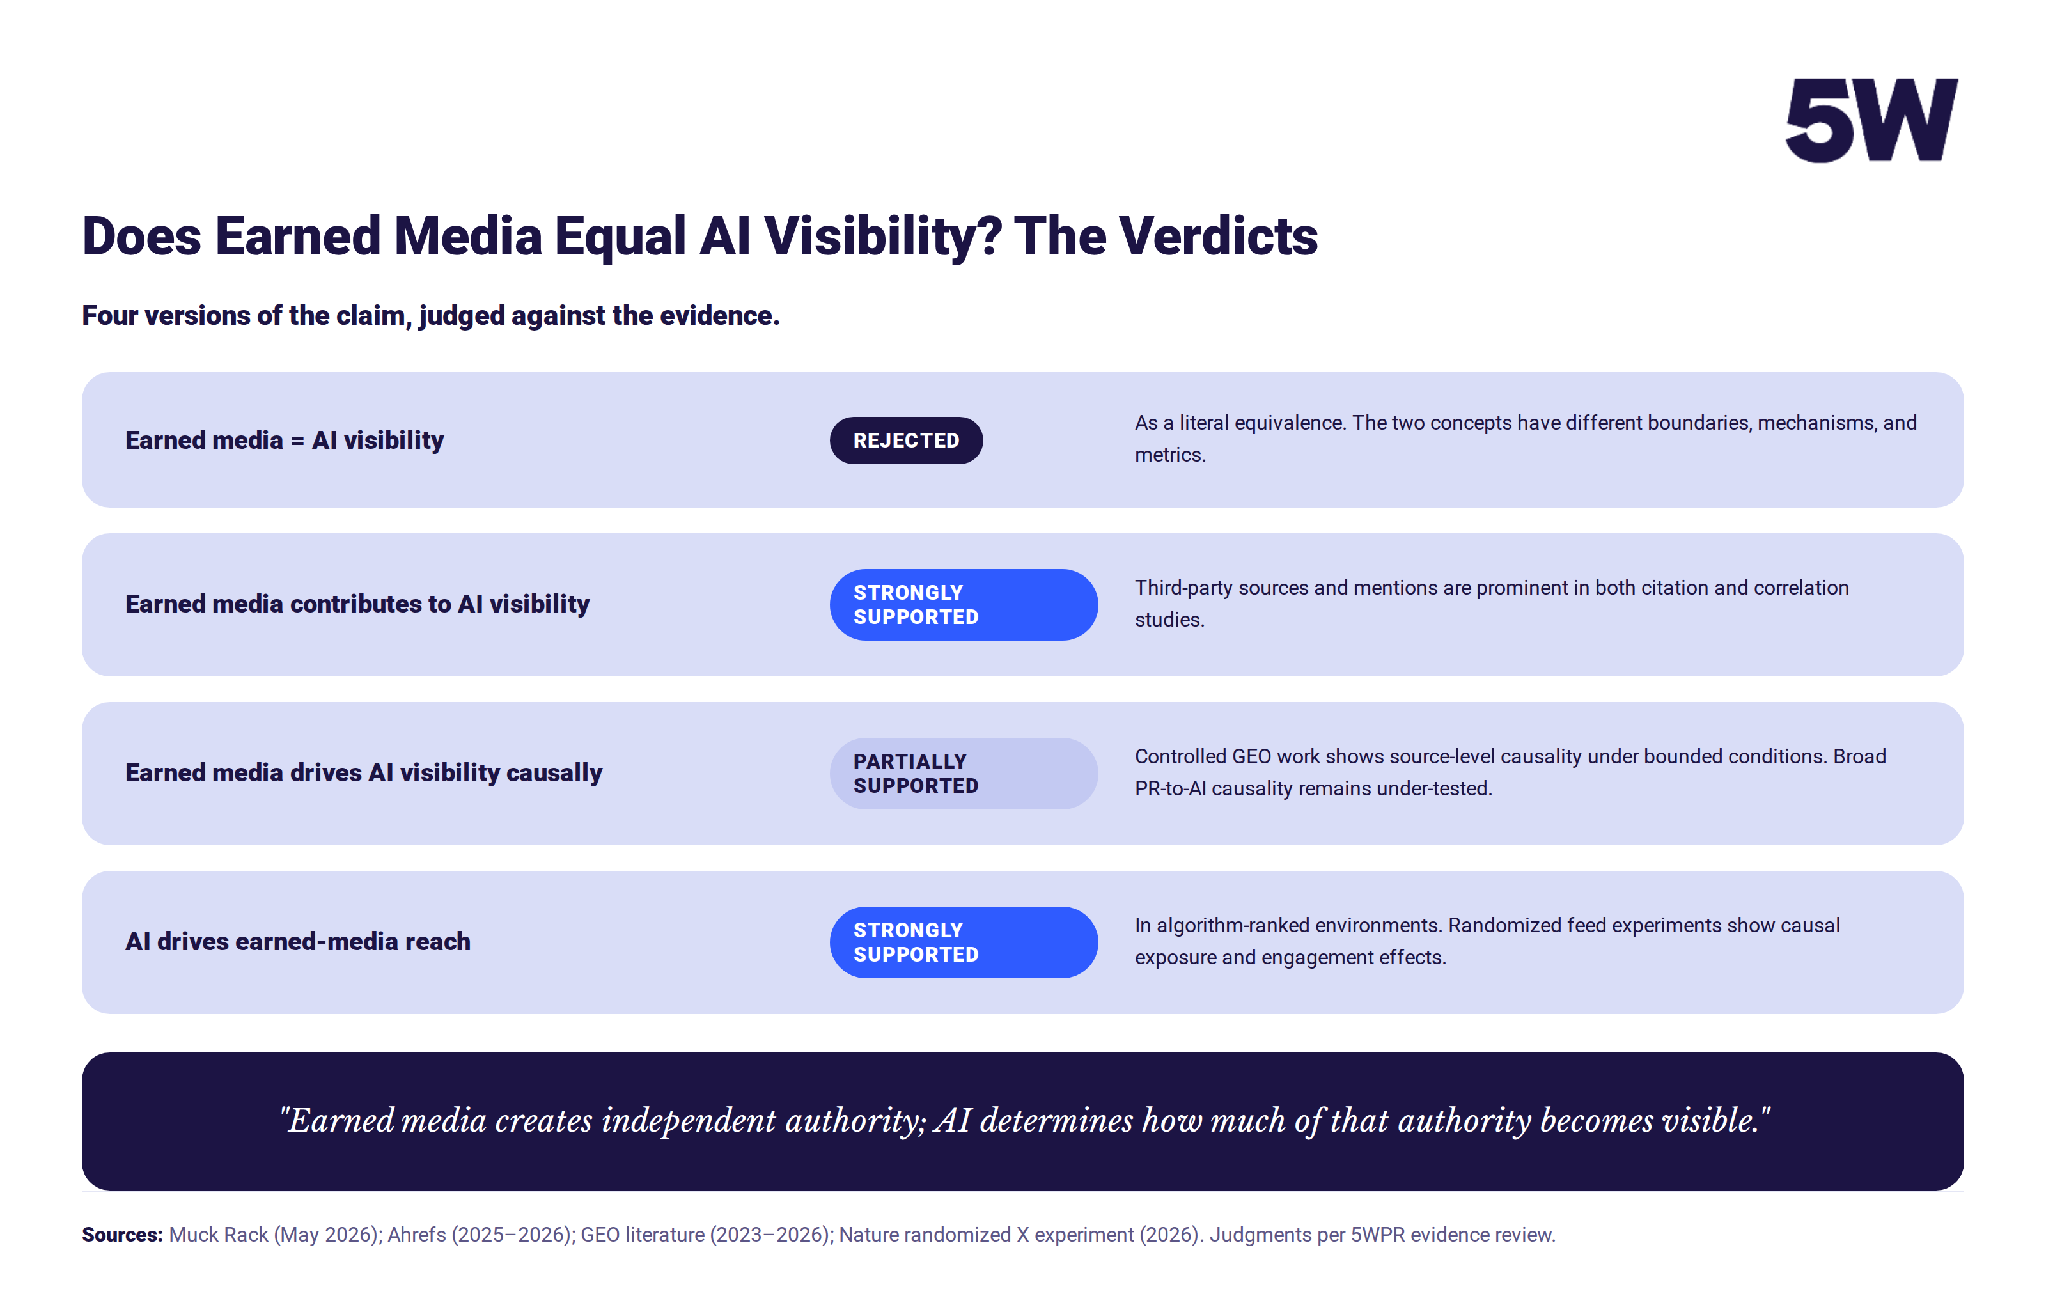
A helpful rule of thumb: earned media creates independent authority; AI determines how much of that authority becomes visible. Think of earned media as the raw material of AI visibility and AI as an editor that decides which earned authority gets published. 5WPR creates earned and owned media campaigns that influence humans and machines. Start a conversation with us today to increase recommendations in AI answers.